Heatmap Calendar With Seasons
The heatmap calendar (with seasons) is a perfect homepage for your Obsidian setup. It tracks and displays your most productive and least productive days in a heatmap calendar. Some people might know it as a GitHub-style calendar.
Heatmap Calendar (with Seasons)
The heatmap calendar (with seasons) is a perfect homepage for your Obsidian setup. It tracks and displays your most productive and least productive days in a heatmap calendar. Some people might know it as a GitHub-style calendar.
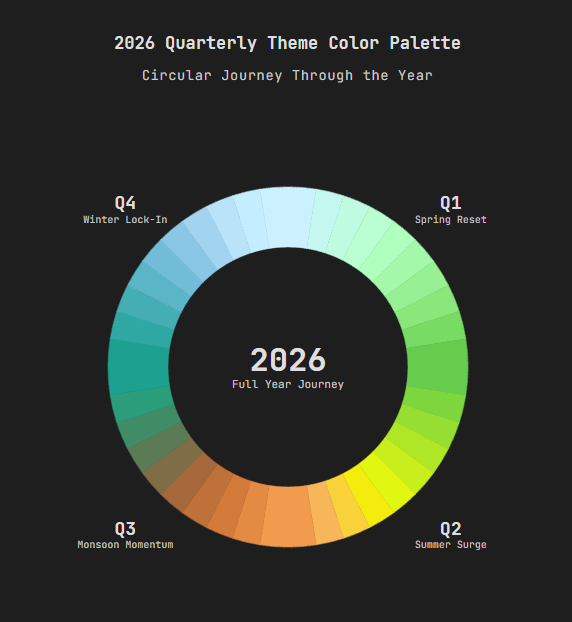
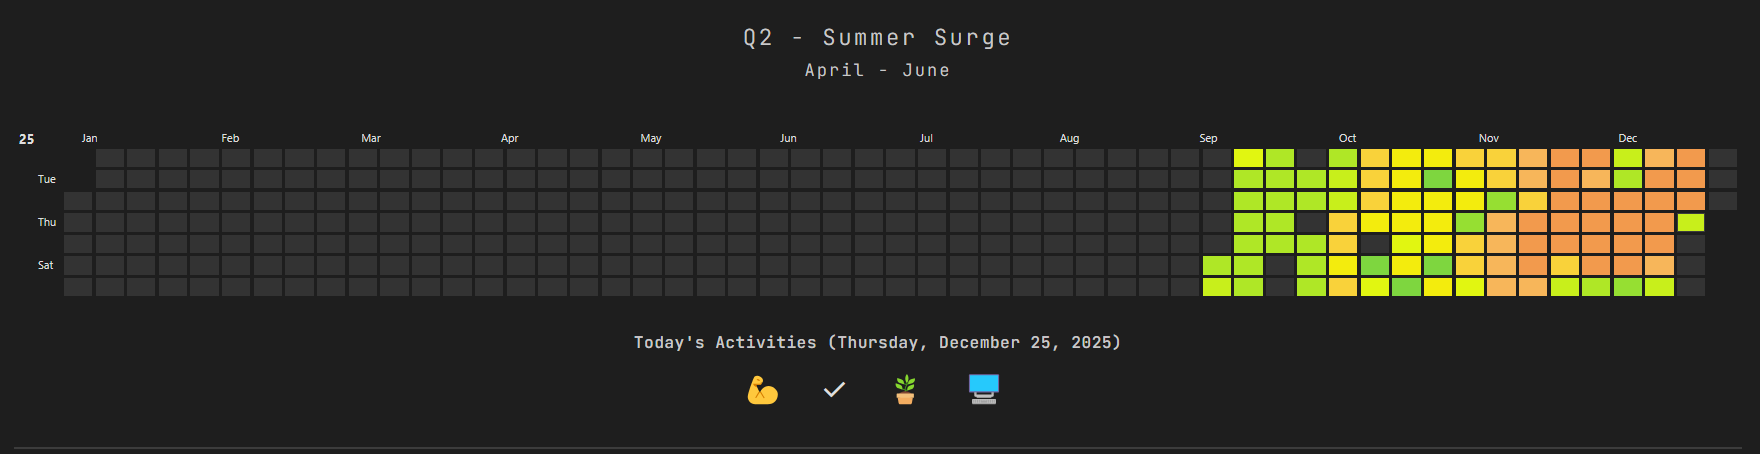
Fun Fact: The most productive colour for a season is the least productive colour for the next season.
"#66CC4E"in the Winter/Spring Reset (Quarter 1) is the first colour in the Summer Surge quarter (Quarter 2).
It requires Dataview and Heatmap Calendar for it to work.
I have a lot of activities in a day, so my colour palette is huge (10 colours). You can shorten it as per your preferences or use cases.
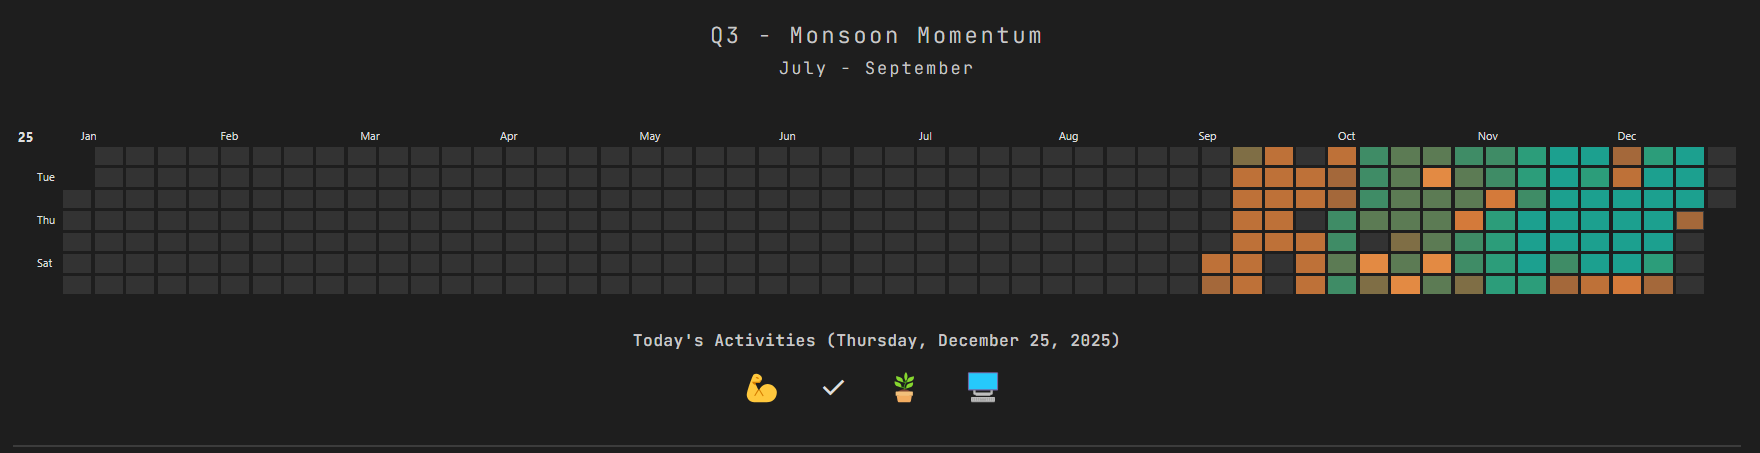
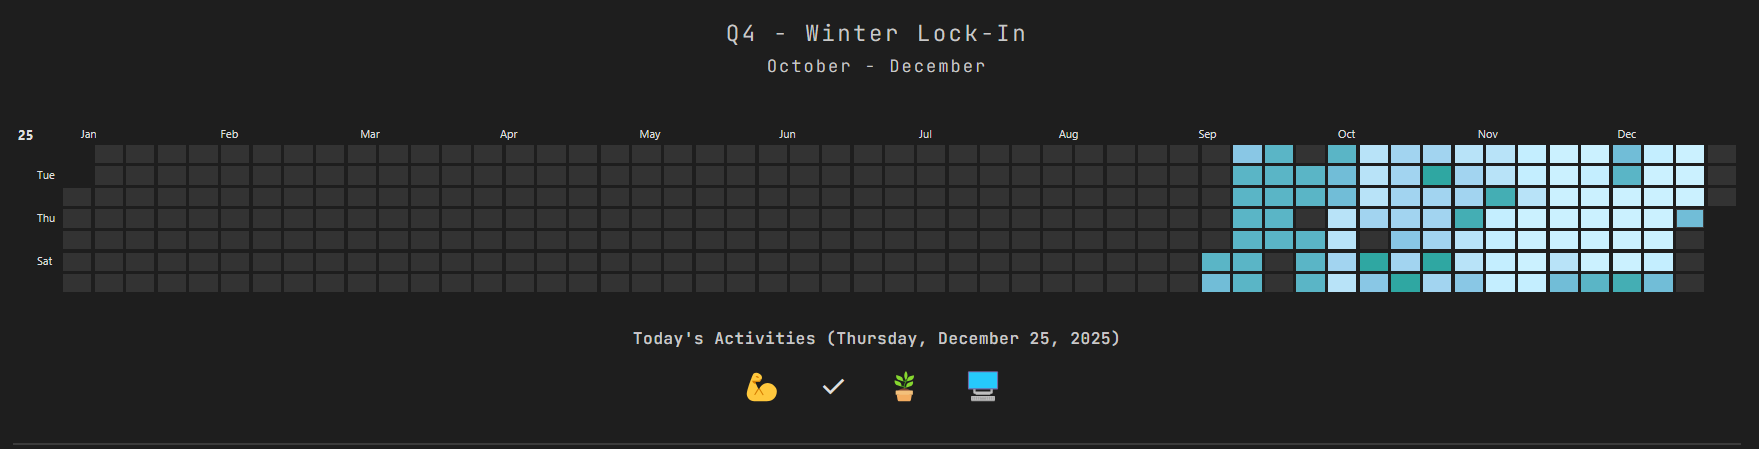
This are the default quarterly themes:
How to Use?
Just paste the code you like in your note starting from ```dataviewjs and end it with ```.
In const activities = [], you can edit the following:
source= folder where your daily notes are savedfield= name of the property (must be a checkbox)emoji= emoji you want to display for the activitiescolour= can be anything (you can even reuse the colours)
You can change or modify the headers and other UI as per your liking.
🥂 New Year Edition
The New Year Edition (NYE2026) bring you new colours for calendar and a stylish header. You can couple this with Global Fireworks for the best experience.
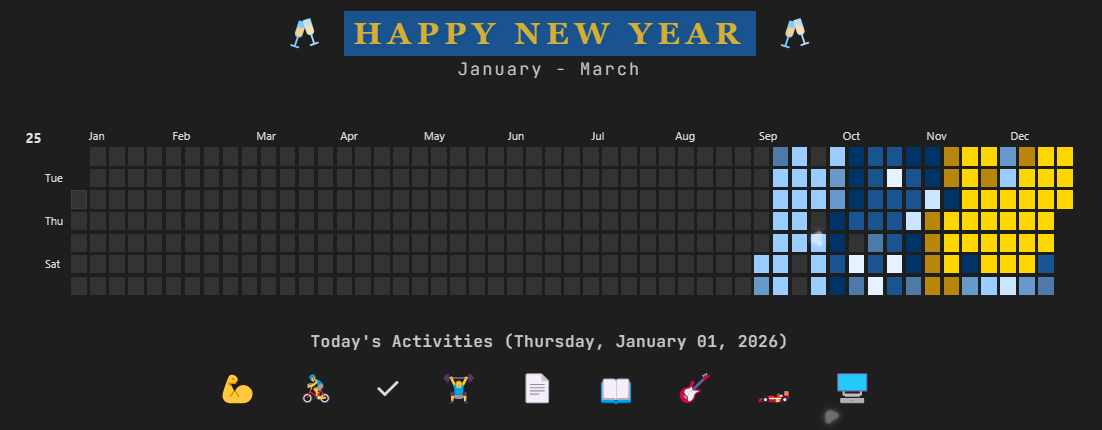
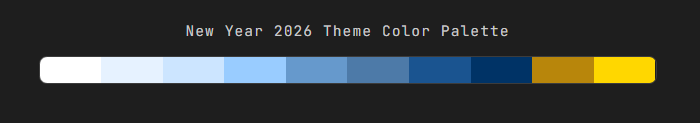
The New Year Edition 2026 Theme Palette:
🎄 Christmas Edition
I made a huge mistake and forgot to attach the code for snowflakes below the xmas25.js. I have attached the code now. You can use the snippet independently too.
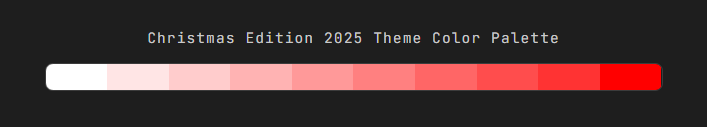
The Christmas Edition 2025 Theme Palette:
The Christmas Edition adds a subtle snowfall effect to your Obsidian desktop. Snowflakes fall gently and disappear automatically after a short time.
You can control the intensity using const SNOWFLAKE_COUNT. For best performance and a distraction-free experience, keeping it around 5 is recommended (I personally use 5 too). The amount used in the video and GIF is 10.
You can enable and disable the snow by changing the values in const ENABLE_SNOW. To stop the snowflakes immediately, you can replace true with false.
If you want to just add the snowflakes to your note, you can copy the code from // Snow Animation to document.body.appendChild(snowContainer); and then paste it above // Calendar Configuation. This way you keep your existing customization and activities.
Or to test the snowflakes, just paste the entire xmas25.js in your note and switch the note to Reading view.
Important: You can even paste the snippet as a separate DataviewJS code, and it will work perfectly.
If the GIF feels laggy, you can check the higher-quality xmas25.mp4 in the preview folder.
Changelog
- 1.1.4
I have now uploaded autoSwitch.js. This will auto-switch the colours and headers depending on the quarters of the year. This includes all the default Q1.js, Q2.js, Q3.js, and Q4.js. You can even include the Christmas and New Year Edition themes in autoSwitch.
- 1.1.3
The calendar will now change the years automatically. I have updated year: 2025, to year: new Date().getFullYear(),. Update is made for all seasons and Christmas Edition.
- 1.1.2
You can now set a global journalFormat as per your preference. It can be YYYY-MM-DD (which is the default) or DD-MM-YY as some people might prefer to store their notes.
- 1.1.1
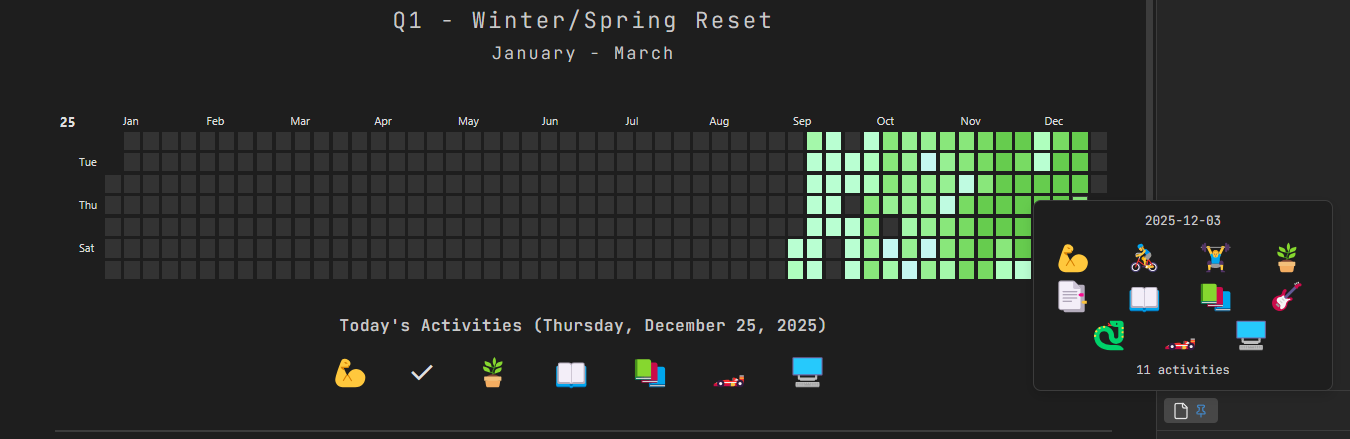
You can now hover over a particular cell and it will display the icons/emojis of the activities you did on that particular day. It will also show you the amount of activities you did on that day.
Screenshots
Versions
- 1.1.4 - 1 January, 2026
- 1.1.3 - 31 December, 2025
- 1.1.1 - 25 December, 2025
- 1.1.0 - November, 2025
How to Install
- Download the ZIP or clone the repository
- Open the folder as a vault in Obsidian (File → Open Vault)
- Obsidian will prompt you to install required plugins
Stats
Stars
16
Forks
0
License
MIT
Last updated 6mo ago
Categories